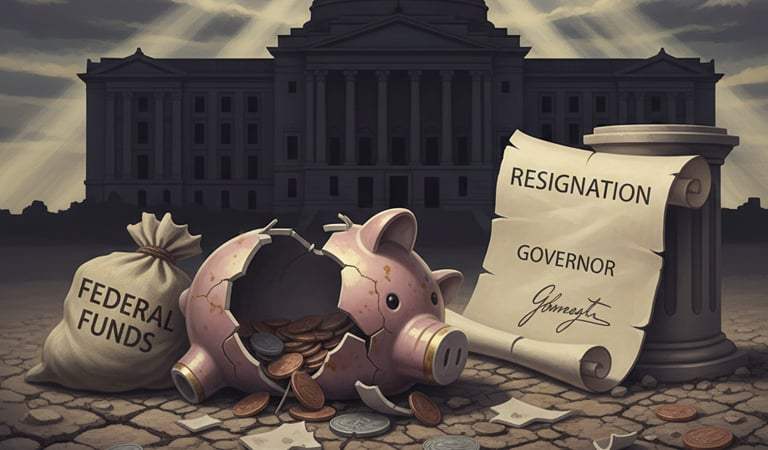

Overview: The U.S. Census determines political representation and the distribution of over 1.5 trillion dollars annually for schools, healthcare, and urban transit. While recent federal reports highlight a record-low Hispanic poverty rate of 13.9 percent and Black poverty at 17.3 percent, outdated 1960s metrics mask severe living expenses. Chronic undercounting in minority zip codes starves neighborhoods of vital federal investments, creating a ten-year cycle of economic disinvestment that requires grassroots field operations and modern poverty formulas to fix.
Ghost Towns on Paper: The Hidden Battle Over Census Headcounts, False Poverty Lows, and Stolen City Budgets
The Quiet Power of the Headcount
Every ten years, the federal government runs the biggest financial audit in American history. It looks like a routine stack of paperwork or an innocent digital form. Do not be fooled. The census is raw political leverage, urban power, and cold hard cash.
When your block gets counted accurately, your streets get paved, your hospitals stay open, and your political representation expands. When you get skipped, your neighborhood is erased on paper for an entire decade. It is that cutthroat.
Between those major decennial counts, ongoing surveys track population shifts, median household income, and federal poverty thresholds. These numbers dictate who controls Congress and where trillions of dollars in federal grants land. If you care about economic equity, small business growth, or generational wealth, the census is ground zero.
The Machine Behind the Count and the Trillions at Stake
The Census Bureau gathers its data through online portals, mailed questionnaires, and ground-level door knockers hitting pavement across every zip code. That data triggers two massive levers that shape everyday reality.
First comes raw political clout. The count decides how the 435 seats in the U.S. House of Representatives get divided across states. It also draws the boundaries for state legislative seats and city council wards. When numbers drop, political power vanishes, leaving working-class districts stripped of genuine representation.
Second comes the money. Washington uses census formulas to distribute more than 1.5 trillion dollars annually. We are talking about Title I funding for urban schools, Head Start classrooms, Medicaid reimbursements, SNAP assistance, public transit grants, and disaster relief. If your neighborhood misses an accurate count, you pay federal taxes for ten years while another zip code gets your infrastructure money.
Why Underrepresented Neighborhoods Get Erased
Counting an entire nation is messy, and historical blind spots always hit marginalized communities hardest. Low-income urban zip codes, immigrant families, and tribal lands consistently face the highest undercount rates in the country.
Digital divides lock people out immediately. When the government pushes digital-first forms into neighborhoods that lack high-speed broadband, response rates plummet. If materials are not translated into native dialects and common local languages, the form ends up in the trash.
Deep institutional distrust creates another massive barrier. Decades of civic neglect, fear of immigration enforcement, and skepticism around data surveillance make families keep their front doors locked.
Urban housing crunches make the problem worse. When high rents force three generations or multiple families to share a single rowhouse, converted garage, or basement apartment, standard census forms fail. People living in informal housing arrangements simply do not show up on official municipal ledgers.
Out on tribal lands and in isolated rural areas, the absence of standard postal addresses forces census workers to guess across vast territories without local guides.
Are Minority Poverty Rates Really at Historic Lows?
Recent economic reports from the Census Bureau made headline noise by declaring that the official Hispanic poverty rate dropped to a historic low of 13.9 percent. That is the lowest recorded figure since federal tracking started back in 1973, dropping sharply from previous decades when rates routinely climbed past 20 to 30 percent.
For Black and Native American families, the narrative gets much more complicated.
The official Black poverty rate landed at 17.3 percent. While that represents massive ground gained since 1966, when Black poverty hovered at a staggering 41.8 percent, it is not an all-time low. It sits slightly higher than the record 17.1 percent logged back in 2022.
The picture is even tougher across Native American and Indigenous communities. Under the Supplemental Poverty Measure, estimated rates sit between 19.8 and 22 percent. Indigenous populations continue to face a brutal overrepresentation ratio of about 1.6 compared to the national average.
Here is the real problem with celebrating these numbers: the official poverty measure is fundamentally broken. It still relies on an outdated formula cooked up in the 1960s based solely on the cost of basic food multiplied by three. It completely ignores astronomical modern housing costs, runaway childcare expenses, and medical debt.
When you look at the Supplemental Poverty Measure, which accounts for real expenses like skyrocketing rent, utilities, and regional costs of living, the illusion fades. Families are still getting crushed by everyday prices, even if headline government press releases claim victory.
The Toxic Loop: How Bad Numbers Lock In Poverty
Poverty statistics and census headcounts feed directly into each other. The census decides where the official poverty line sits and determines which specific census tracts qualify for federal relief, New Markets Tax Credits, and community development block grants.
If an urban community gets undercounted, its official poverty numbers look smaller than the reality on the ground. That statistical lie starves the community of capital.
Cities receive fewer federal dollars to run job training centers, expand clinic hours, or upgrade bus routes. Without working infrastructure, small businesses struggle to scale, working families stay stuck, and poverty calcifies. Ten years later, the census comes back, counts fewer thriving households, and the cycle starts all over again.
The Blueprint to Fix the Count and Reclaim Capital
Fixing the census cannot be treated as a bureaucratic exercise run from Washington desks. It requires a ground game built on trust, localized capital, and modern math.
First, stop trying to count communities without the people who live in them. Washington needs to stop sending outside strangers to knock on doors in neighborhoods they do not understand. Federal funding should go straight to local grassroots organizers, faith leaders, urban media publishers, and neighborhood elders who already command authentic respect on the block.
Second, ditch the outdated 1960s poverty formulas. Federal agencies must permanently transition to realistic measures that reflect what it actually costs to keep a roof overhead, pay for prescription drugs, and put groceries on the table in modern urban markets.
Third, recruit enumerators directly from the zip codes being surveyed. Hire local residents who know the landlords, understand the building layouts, speak the language, and have the cultural awareness to get doors open.
Finally, keep the census independent and aggressive. Protect field operations from partisan budget cuts and guarantee absolute data privacy so residents can claim their rightful place without looking over their shoulder.
The census is not an abstract statistical survey. It is a power ledger. If we want our communities to stop getting shortchanged on schools, hospitals, and economic development, we have to treat the count like the multi-billion-dollar game of territory that it is.
#CensusMatters #EconomicJustice #CommunityEquity